How to Read a Histogram
The histogram is your X-ray of light: there is no perfect histogram, only the right histogram for each type of image.

If the histogram hugs the right edge you've lost the highlights and they don't come back; if it hugs the left you lose shadows, and from those RAW recovers 1 or 2 stops. That asymmetry is the only rule that always applies: when in doubt, protect the right.
The histogram is your "X-ray of light" (a graph that shows the tonal distribution of your image). There is no "perfect" histogram, only histograms appropriate for each type of image. The peak toward the left indicates shadows, the center is midtones, and the right is the bright highlights. The height shows how many pixels there are in each tonal zone.
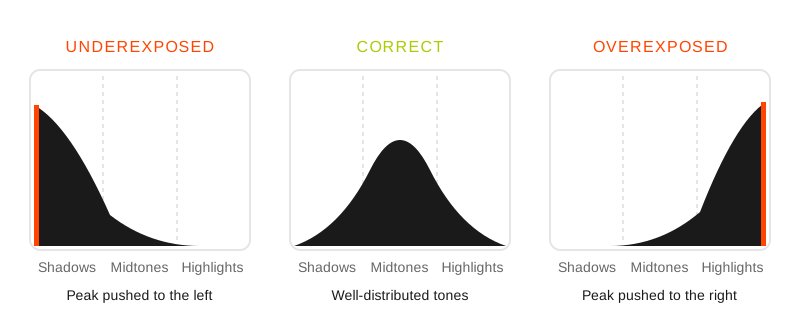
The position of the peak reveals the exposure: pushed to the left is underexposure, centered is balance, pushed to the right is overexposure.
How do you read the histogram?
The vertical axis runs from fewer pixels to more pixels. The horizontal axis is divided into five tonal zones:
Blacks: pure blacks.
Shadows: darker exposure.
Midtones: medium exposure.
Highlights: brighter exposure.
Whites: pure whites.
What is the shape of the curve telling me?
Neutral exposure (healthy histogram): this reading produces a safer exposure. The midtones as well as the brightest and darkest tones are present in a harmonious way.
Underexposure: we only have information in the darkest tones of the graph. Use wider apertures or a longer shutter speed. Try to avoid this reading.
Overexposure: this setting eliminates a lot of image detail by saturating the highlight area. Use a lower ISO to avoid it. Overexposed photographs are harder to recover in post-production.
What shape should I expect in each scene?
Scene: High-key portrait; Correct shape: loaded to the right, without touching the edge; Risk: blowing out the skin; What to do: −1/3 EV as soon as the zebras appear
Scene: Sunset silhouette; Correct shape: two peaks at the extremes, a valley in the center; Risk: none: it is the goal; What to do: meter on the sky and leave black as black
Scene: Balanced landscape; Correct shape: centered bell; Risk: simultaneous clipping at both ends; What to do: bracketing and later blending
Scene: Night scene; Correct shape: mass in the left third; Risk: noise when lifting shadows; What to do: expose as far to the right as the movement allows
None of those four shapes is "correct" outside its scene: a centered histogram on a silhouette means you have ruined the silhouette. The case of the landscape that touches both extremes at once is developed in the guide to exposure in complex landscapes, and reading on the fly, with the camera in hand, in how to read the histogram while you shoot.
How to leave it turned on in your camera
Turn on histogram display on your camera's LCD.
Use the highlight alert (zebras) as a complement.
On cameras without a live histogram, check after every important shot.
Learn to read separate RGB histograms for color balance.
The mistakes that cost you files
Chasing a "centered" histogram in every situation.
Ignoring information loss at the extremes of the graph in high-contrast scenes.
Not considering creative intent when evaluating the histogram.
Relying only on the camera screen without checking the histogram.
Professional tips
Expose for the highlights, to maximize the sensor's dynamic range.
If there is information loss in the highlights, lower the exposure; if it's in the shadows, adjust it in post-production.
For important series, bracket your exposures.
Don't get discouraged. The more you practice, the better your results will be.
Frequently asked questions
Is there a perfect histogram?
No. The correct histogram is the one that corresponds to the scene: a silhouette produces two separate peaks, a night scene piles up on the left and a high-key portrait piles up on the right, and all three exposures are good. Chasing a centered bell in every situation is the most repeated mistake with this tool.
What does it mean when the histogram touches the right edge?
That there are saturated pixels: in that area the sensor no longer recorded differences in tone and the file holds nothing to recover. Lower the exposure until the curve lifts off the edge; if the whole scene doesn't fit, decide which highlights you can sacrifice (the sun, a street lamp) and protect the rest.
Is the camera's histogram the RAW's histogram?
No: the camera calculates the histogram from the preview JPEG, with the profile and contrast applied. That's why the RAW usually retains between half a stop and one stop more highlights than the screen shows you, and why it's best to trust the zebras as a warning and not as a verdict.
What are zebras and how do they differ from the histogram?
Zebras mark on the image, with flashing stripes, the areas that exceed a brightness threshold, so they tell you where the problem is; the histogram tells you how much of a problem there is. Use both: the histogram to decide the exposure and the zebras to know whether what's blowing out is the subject's forehead or a street lamp in the background.
What to look at before moving on to the next photo
A two-second glance: does the curve touch the right edge? Is the mass where the scene calls for it? If the answer to the first is yes and it isn't a light source, correct the exposure with compensation before repeating the shot, not at home.
The 44 cards from Enfogram have the histogram shapes by scene printed on them, so you can recognize them on the screen without having to interpret them from memory.